Forums › Dashboards & Analyzers › RSI Breakout from Overbought Oversold Dashboard › Description of RSI Breakout from Overbought and Oversold Dashboard Analyzer
- This topic is empty.
-
AuthorPosts
-
26.07.2016 at 13:49 #4488
 DominikAdministrator
RSI Breakout from Overbought and Oversold Dashboard is one of my best indicators available through official MQL site (https://www.mql5.com/en/market/product/15750).
It is a tool for multiple currency pairs analysis at the same time in terms of breakout from Oversold or Overbought Zone.
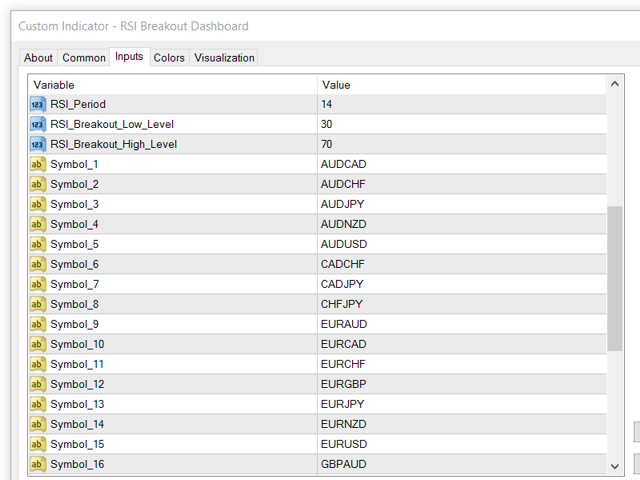
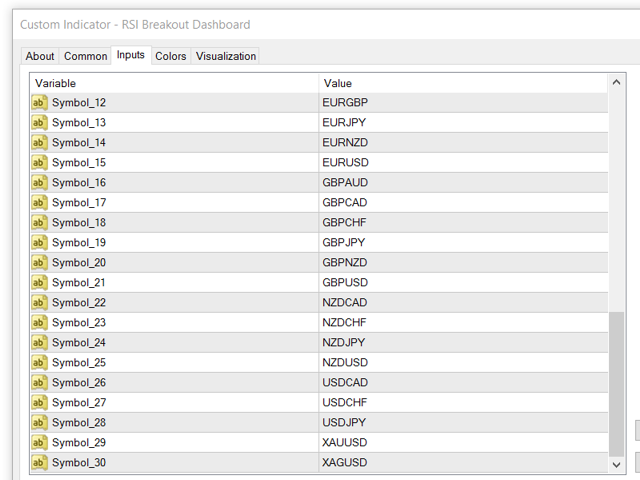
The number of displayed symbols is 30 and the name of each symbol can be edited in the parameters.
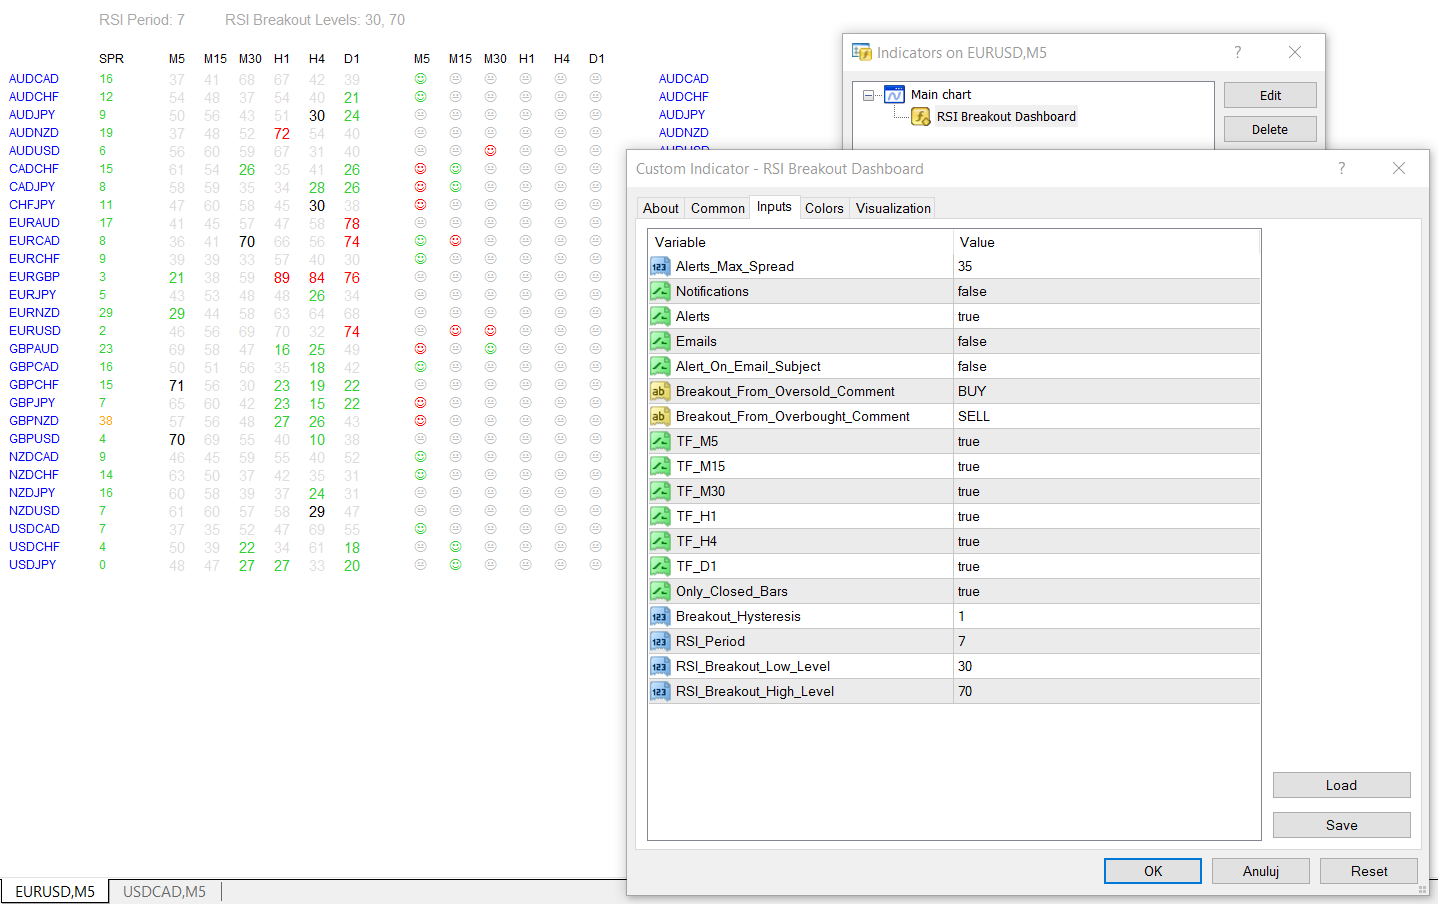
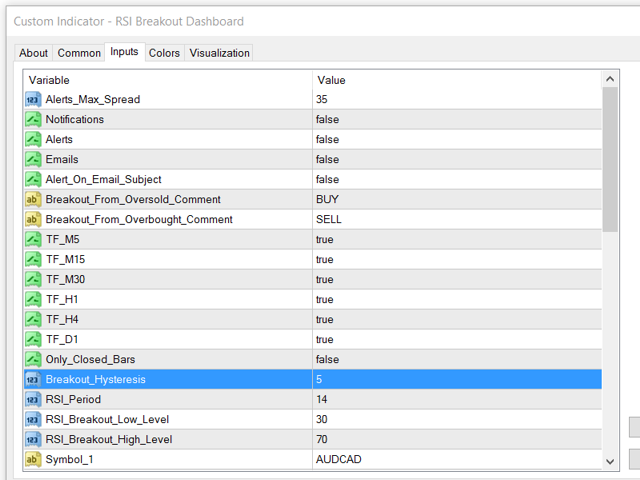
Analyzer is perfect for alert notifications, push notifications and email alerts. We can also select timeframes to receive notifications from and set maximum spread, at which the notifications will come.
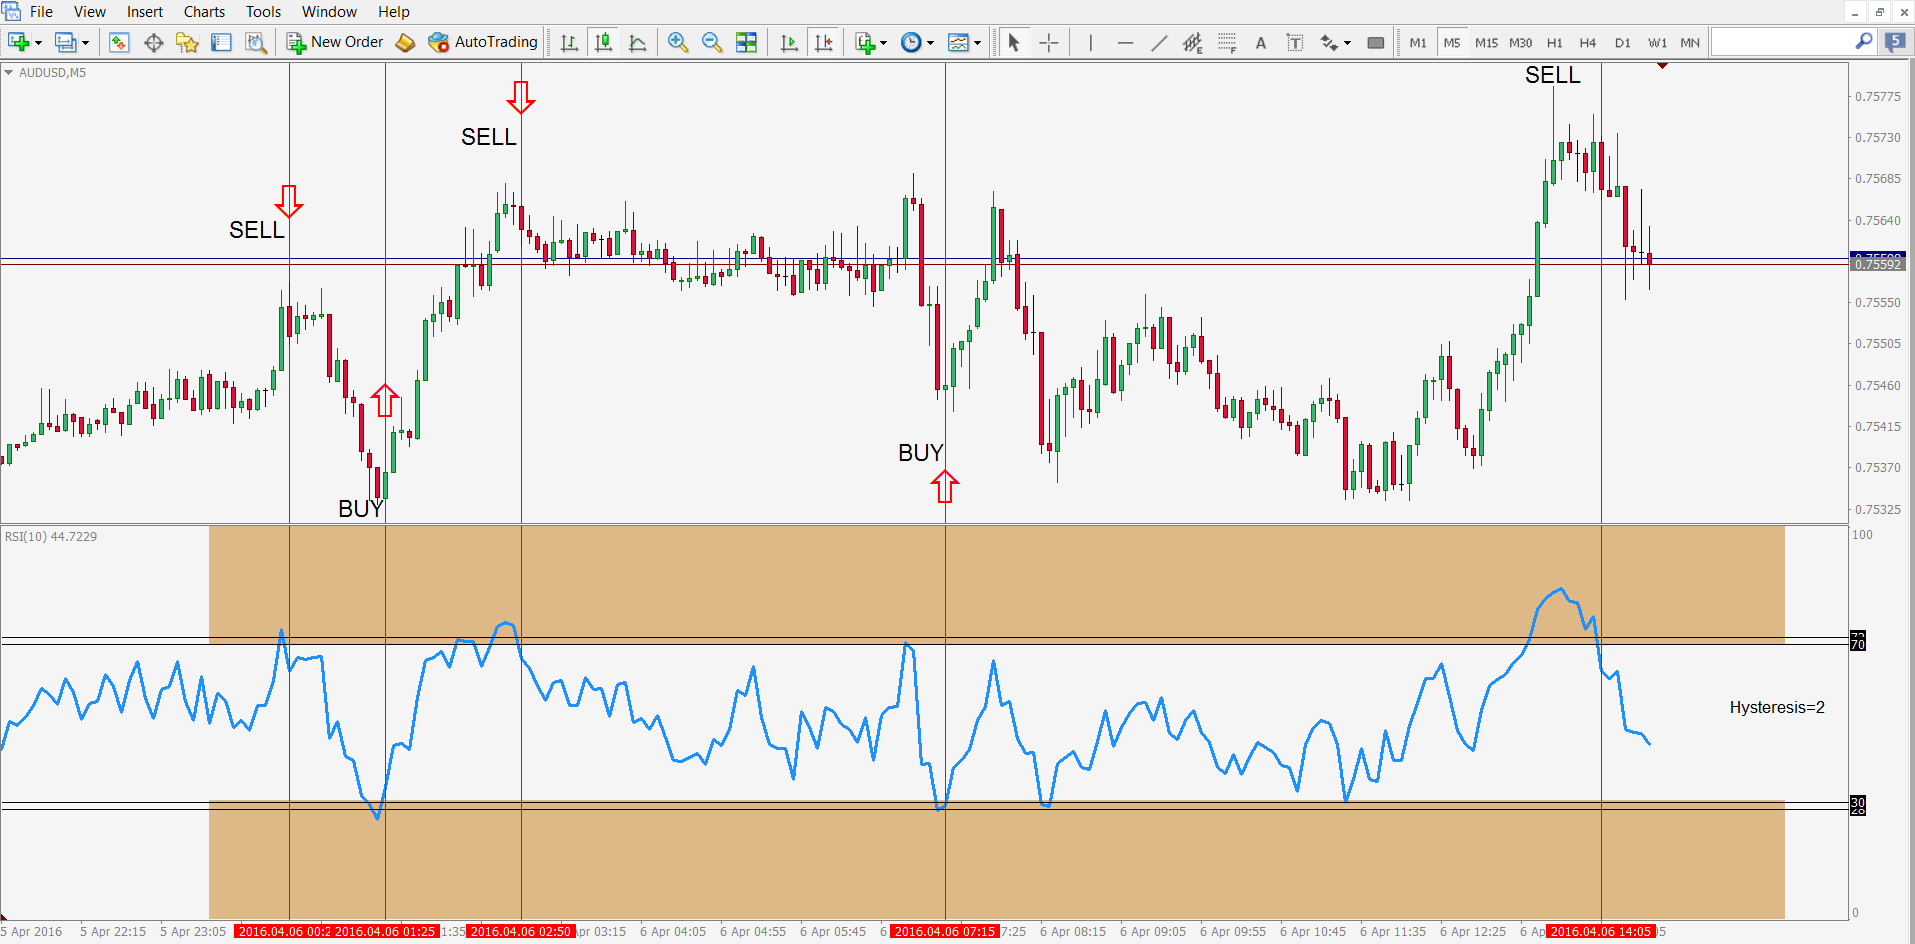
The most important parameters are period of RSI (“RSI_Period”) and 2 RSI Levels (“RSI_Breakout_Low_Level”, “RSI_Breakout_High_Level”). We get notifications above low and below high level if the value of RSI previously exceeded high or low level increased or decreased with value of hysteresis (“Breakout_Hysteresis”). That gives us opportunity to filter bad/false signals from fluctuations of the RSI value.
The best explanation will be an example
We set three parameters:
RSI_Breakout_Low_Level=30
RSI_Breakout_High_Level=70
Breakout_Hysteresis=5
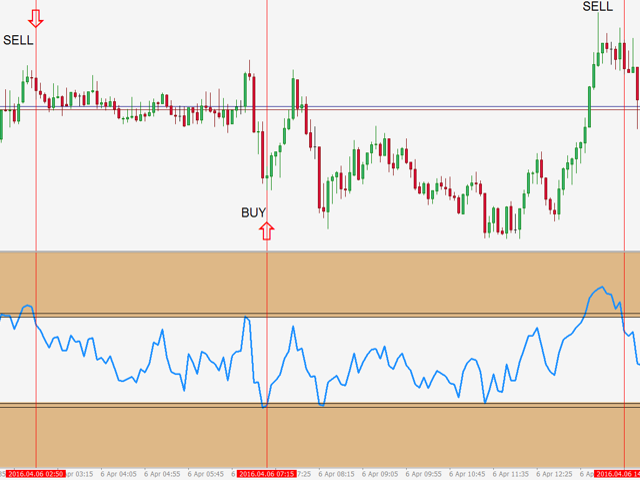
Oversold – BUY (RSI goes from Oversold to Neutral Zone):When the value of RSI appears below or is equal to 25 (RSI_Breakout_Low_Level – Breakout_Hysteresis) indicator waits until RSI_Breakout_Low_Level is crossed and then trigger the alert. In case of overbought is inversely.
Another parameter is “Only_Closed_Bars”. If set to “True” indicator analyzes only values from closed candles and alerts come after candles are closed. If set to “False” – values are analyzed in real time and alerts come immediately from current values. With “Only_Closed_Bars” we can filter signals, which I call “noise”, between closures of candles.
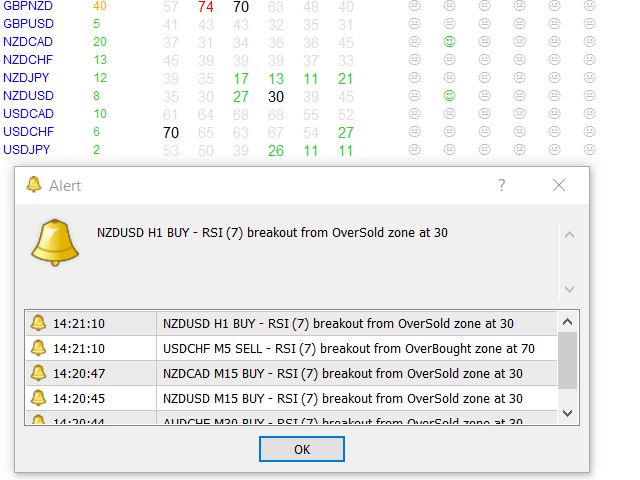
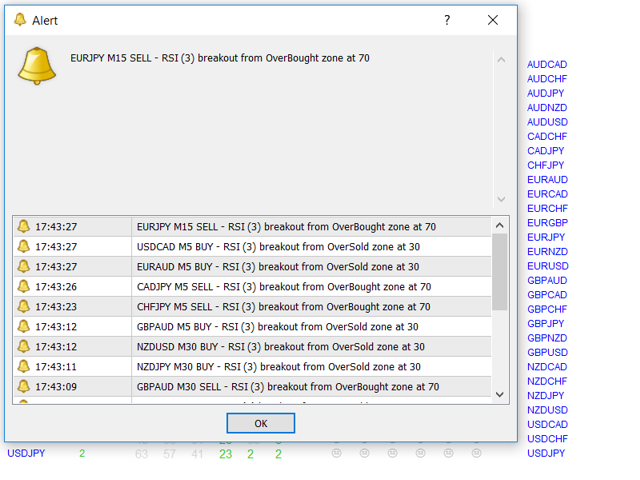
For every alert we can add comments:”Breakout_From_Oversold_Comment” (default: “BUY”) and “Breakout_From_Overbought_Comment” (default: “SELL”), which are embedded between timeframe and RSI period. Information received in the alerts are: symbol, timeframe, comment, RSI (with given period) breakout from OverSold/OverBought zone at RSI level, eg.:
EURUSD M15 BUY – RSI (14) breakout from OverSold zone at 30.
If we leave blank fields in these parameters we will get alerts without comments.
We can also choose whether the whole text of email alert is in the body or in the subject of email message (“Alert_On_Email_Subject”). When set to False alerts look like:
Subject: GBPUSD
Body (comments on): M15 SELL – RSI (14) breakout from OverBought zone at 70
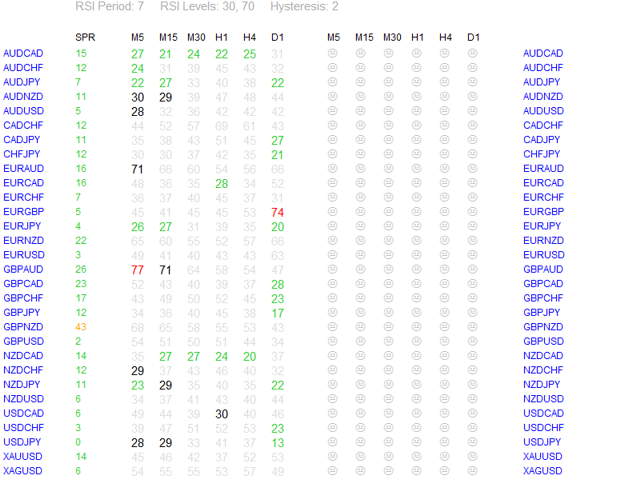
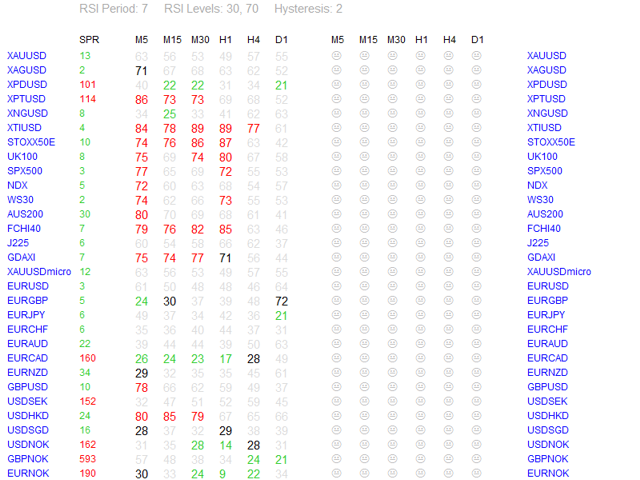
If we set “Alert_On_Email_Subject” to True – whole text will be in subject.In header of dashboard are displayed 4 actual parameters: RSI Period, RSI Breakout Low and High Level and Hysteresis.
Displayed values of RSI are rounded to the nearest integer.
Color green means that value of RSI is below RSI_Breakout_Low_Level decreased with Breakout_Hysteresis (Oversold Zone).
Red – RSI is above RSI_Breakout_High_Level increased with Breakout_Hysteresis (Overbought Zone).
Black – RSI is between RSI_Breakout_Low_Level-Breakout_Hysteresis and RSI_Breakout_Low_Level or between RSI_Breakout_High_Level+Breakout_Hysteresis and RSI_Breakout_High_Level (Hysteresis Zone).
Gray – RSI is between Low Level and High Level (Neutral Zone).
We can set maximum spread at which the notifications will come with “Alerts_Max_Spread”. Spread values can have different colors. When value is lower or equal to maximal spread the color is green, between 1 and 1.5 times higher – orange and above 1.5 times higher – red.I suggest to make a new template with “RSI Breakout Dashboard” and scheme without colors (“None”), only Background and Foreground setted to “White”.
Any questions, comments, opinions and ideas are welcome here!
Good luck in trading!
 26.07.2016 at 16:31 #4684
mrzet555
SpectatorDominik

Thanks for allowing me to the forum. Your RSI dashboard is really marvelous. I am using it profitably. However, kindly add 15 days Daily range and and 13 weeks weekly range. I am using Access Panel indicator by Professor TAH on forexfactory which gives very good signals. I look for M5 reversal signals after H1 and H4 rsi are above 75-80 levels.
Kindly adopt that range indicator in your dashboard.
Thanks for everything
 26.07.2016 at 16:57 #4685
 DominikAdministrator
@mehtabkk wrote:
Dominik

Thanks for allowing me to the forum. Your RSI dashboard is really marvelous. I am using it profitably. However, kindly add 15 days Daily range and and 13 weeks weekly range. I am using Access Panel indicator by Professor TAH on forexfactory which gives very good signals. I look for M5 reversal signals after H1 and H4 rsi are above 75-80 levels.
Kindly adopt that range indicator in your dashboard.
Thanks for everything

Hi!
Thanks
 I think that you mean RSI Dashboard which shows extremely values of RSI – when specified currency pair is in Overbought or Oversold Zone? This topic is about RSI BREAKOUT Dashboard FROM Oversold or Overbought Zone… nothing happened, but it’s a good opportunity to explain a little
  I know that both dashboards are very similar. The most important difference between them is that RSI EXTREMES Dashboard (I have even added “Extremes” to name for easier distinguish both) shows if value of RSI is in Oversold or Overbought Zone and RSI BREAKOUT Dashboard shows when value of RSI was in Oversold or Overbought Zone and after specified value of hysteresis returned to Neutral Zone.
For some time, I test all the signals (for different settings) which come from RSI BREAKOUT Dashboard and I put them directly to my twitter account, you can take a look: https://twitter.com/ForexSignals24h – it’s better signal than from RSI EXTREME in one important regard, we receive notification just after rebound of the value of RSI from extreme value. I don’t have much time to analyze all the signals on twitter account to exclude potentially bad entries and correct settings, but I will do it for sure

Regarding your request to add new options to the system – can you write that once again, but more specifically? What exactly do you propose to add and with which adjustable parameters? Please write in topic of RSI Extremes Dashboard here: https://theinvestbay.com/viewtopic.php?f=6&t=15
Regards!
25.01.2017 at 11:05 #468617.02.2017 at 15:24 #4687Eroll Zach
SpectatorWhat are the smily faces for? Is buy/sell signals for specified timeframe? If yes, when do the show up? If no, what are they?
 18.02.2017 at 16:52 #4688
 DominikAdministrator
@mariusz wrote:
What are the smily faces for? Is buy/sell signals for specified timeframe? If yes, when do the show up? If no, what are they?

Smiley faces mean “signal sent”

-
AuthorPosts
- You must be logged in to reply to this topic.

